I guess someone's got to do it 
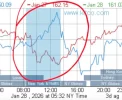
<<=============SIDEWAYS!!!!!!!===============>>
")

<<=============SIDEWAYS!!!!!!!===============>>


Opposite here in Aus , nobody selling back to the dealers .APMEX has raised their minimum sell amount to $20k from $10k and the buy minimum is still $500.
Being overrun with sellers same as the coin shops id guess.
If you arent selling $20k worth they arent interested.
")
 www.macrotrends.net

told everyone to buy usd in 2011 no one listened not even me lolCan the Aussie dollar go to paraty ?
It has before & that's when I was making $
Australian to US Dollar Exchange Rate - AUD USD (1991-2026)
Interactive historical chart showing the daily Australian Dollar - U.S. Dollar (AUDUSD) exchange rate back to 1991.