RBA

I came back to see if you still think inflation is transitionary and if running massive government deficits into full employment and an every growing bureaucracy is not adding to inflation?
We don't have full employment. :rolleyes:

Now, as long as governments keep responding to inflationary pressure with outdated monetary policy strategies, and as long as supply chains keep being disrupted then we'll have inflationary price pressure over and above what is consistent with long term monetary inflation expectations. The initial period of inflation due to COVID was transitory, it did last longer than expected but inflation dipped. As soon as the supply chains were restored the resource constraints that led to higher prices saw prices fall, lettuce were $6 each now they're $2 - $3.

Then we've got dickheads in the USA and Russia starting wars, this has produced another round of supply constraints which has seen energy prices surge, add to this a level of migration that has not been matched by an increase in government spending to meet the demand for services and we've got inflation again.

Labor has done an awesome job in trying to end the gravy train for investors that has seen housing skyrocket in price and become unaffordable for many sectors of society. Hopefully this translates into rents rising more slowly, a down turn in share market activity as well thanks to the new rules again CG which could possibly see investors putting funds into productive activity instead of the droll that has been happening for the last 30 years or so. Unfortunately the RBA is a dinosaur and every rate rise just adds another percentage point or so to inflation, it's entirely self-defeating but mainstream economic thinkers (like yourself) can't understand that.

You're insistence that deficits lead to inflation is indicative of your ignorance of the history of inflation and your lack of understanding of how deficits function. I can show you graphs that prove there is no direct link between rising government deficits and CPI but you're going to ignore them anyway.
 
Last edited:
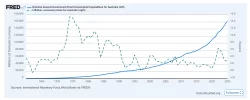
@Lovey80, here you go, here's a chart for you to ignore.

CPI has been in a general down trend since the peak in the 70's which coincided with the final stage in the introduction of government backed fiat, at the same time government expenditure has been rising - just as it should do.

Screenshot 2026-10-15 at 4.42.50 pm.webp
 
What about the forever increasing of government spending and increasing staff with no obvious roi in efficiency. I've personally seen positions being created as a means of career advancement with no real benefit to the strength or efficiency to the taxpayer. The covid stimulus payments that takes years to show up in inflation and more light is being shed on ndis and immigration payments and ftb rorting. The over complicated highly restrictive energy policies that shift so much money off shore and make doing business here highly restricted and expensive, locks inflated international prices in for us to use our own resources. And there's so many more where money is being borrowed or created to facilitate these strategies that don't show up in inflation for at least 18 months
 
John Williams from Shadowstats calculated CPLie as it was back in the 70's and 80's and it's significantly higher than present day indicators.

The government used substitutes to offset price increases ie. "Hedonic Adjustments", for example where they previously used beef as a measure, they swapped it for chicken.

Example 2, a brand new car is about $30k, but they say you get all these new features and technology that justifies the higher price, yet insurance, parts, labour repair quotes, registration have skyrocketed.

You could buy a brand new car for $12990 driveaway with a warranty in the 90's.

They also don't include rent, mortgage payments or fuel prices in the CPLie.

If they were serious about fighting inflation, they would be raising rates by 2.5% a month, not 0.25%. Everyone who understands basic math knows that they can't do this without blowing up the stock and mortgage market.

That's the crux of the problem, most people understand football and player statistics than they do addition, subtraction, multiplication and division.

Next time you go out in public, observe how many people need a machine or calculator to work how how much change to pay back.
 
Last edited:
John Williams from Shadowstats calculated CPLie as it was back in the 70's and 80's and it's significantly higher than present day indicators.

The problem with the Shadowstats data is that it reflects consumption habits and goods that are no longer in demand by today's consumer. That's why the various statistician's departments around the world periodically update their basket of goods to reflect changes in consumer behaviour and the types of goods we're consuming.

The government used substitutes to offset price increases ie. "Hedonic Adjustments", for example where they previously used beef as a measure, they swapped it for chicken.

No it doesn't. It still measures beef, chicken, seafood etc.

They also don't include rent, mortgage payments or fuel prices in the CPLie.

Rent is measured, fuel is measured, mortgages are not because any rate rises introduced in an attempt to combat inflation would result in a vicious cycle of mortgages going up in price creating even higher inflation data. They collect data on new builds.

If they were serious about fighting inflation, they would be raising rates by 2.5% a month, not 0.25%. Everyone who understands basic math knows that they can't do this without blowing up the stock and mortgage market.

A more valid reason is that it would completely tank the economy and create a potential hyperinflationary episode as consumers scramble to purchase as much as they can in the now in order to avoid paying inflated prices in the future. Then we'd all go broke, eat each other's children and eventually die.
 
Last edited:
What about the forever increasing of government spending and increasing staff with no obvious roi in efficiency.

How is ROI being measured in the public sector? You'd have to opt for alternative methodologies as most of the funding is spent on not-for-profit functions. Life expectancy? Childhood mortality/diseases? Cancer survival rates? Murder rates?

I've personally seen positions being created as a means of career advancement with no real benefit to the strength or efficiency to the taxpayer.

Are you a public servant? I'm not but I don't doubt that that occurs. As far as the cost impact goes, creating extra jobs for the sake of it in a workforce of over 2.6 million public sector employees would be difficult to quantify, let alone trying gauge any value if any from those appointments.

The covid stimulus payments that takes years to show up in inflation and more light is being shed on ndis and immigration payments and ftb rorting. The over complicated highly restrictive energy policies that shift so much money off shore and make doing business here highly restricted and expensive, locks inflated international prices in for us to use our own resources. And there's so many more where money is being borrowed or created to facilitate these strategies that don't show up in inflation for at least 18 months

I think the chart I published going back over 50 years is long enough to allow any inflationary lags caused by government policy to show up in the data. And the data shows that inflation has been trending steadily downwards while government spending is always rising.
 
Back
Top